Interpreting Tables and Charts
Reading I: Number of Students of a Public School in Illam
Vocabulary in use
Find the synonyms of the following words from the text.
portrays: depicts, represents, illustrates
discloses: reveals, exposes, uncovers
escalated: increased, rose, soared
precisely: exactly, accurately, strictly
tendency: inclination, leaning, predisposition
stable: consistent, steady, unchanging
Reading comprehension
Choose the best alternative to complete the following sentences.
a. The number of the students in the school was the same in all years.
b. The ratio of the boys and the girls in 2015 was 5:6.
c. The number of girls increased more than the number of boys that decreased.
d. The data presented in the bar chart surprises us because the total figure of the students did not change.
Study the bar chart, and answer these questions.
a. What kinds of data are presented in the above bar diagram?
The kinds of data presented in the bar chart are the number of boys and girls studying in a public school in Ilam each year between the years 2011 and 2015.
b. How many girls were studying in 2015?
There were 600 girls studying in 2015.
c. What was the number of boys that decreased every year?
The number of boys that decreased every year was 25.
d. What percentage of boys decreased over a period of five years?
Over a period of five years, the percentage of boys that decreased was about 16.7% (100/600).
e. What might be the reason behind the decreased number of boys and increased number of girls?
It could be due to various factors such as changes in enrollment policies, changes in the population demographics of the school's catchment area, or other factors.
Reading II: Students Appeared in the SLC Exam in the Academic Year 2072-2073 and their Score in English
Vocabulary in use
Some of the phrases used in the above text to describe the pie chart are given below. Read them carefully and find out other similar expressions that can be used for describing the pie chart.
Here are some other phrases that could be used to describe the pie chart:
- The pie chart illustrates/depicts
- The pie chart reveals that
- The pie chart indicates that
- The pie chart demonstrates that
- The pie chart suggests that
- The pie chart reveals a trend of
- The pie chart presents data showing
- The pie chart provides information about
Reading comprehension
Study the table and the pie chart and indicate whether the following statements are true or false.
a. The pie chart presents the data of all the subjects of the SLC examinees. → False
b. According to the pie chart, the majority of total examinees scored the grade A in the exam. → False
c. The least number of students belonged to the group that obtained B. → False
d. The highest number of students scored D+ grade. → False
e. Among the total students appeared in the exam, only 8.08 per cent scored the grade B. → True
Study the table and the pie chart again and answer these questions.
a. How many students appeared in the SLC examination in the year 2072-073?
The total number of students who appeared in the SLC examination in the year 2072-073 was 436,983.
b. What is the percentage of students who scored grade C+?
The percentage of students who scored grade C+ was 7.31%.
c. Which grade was scored by the majority of the students?
The grade D was scored by the majority of the students.
d. What is the total number of students who achieved the grade D+?
The total number of students who achieved the grade D+ was 71,141.
e. Is the achievement level of the students in the SLC examination satisfactory? Why? Why not?
The achievement level of the students in the SLC examination is not satisfactory. The majority of the students scored the grade D, which is the lowest grade. The percentage of students who scored the grade A+ was only 2.87%, which is very low.
Work in a small group and fill in the gaps with the word(s) or phrase(s) in the box below to make the instruction of making rice pudding meaningful.
As soon as, When, Then, Finally, First, After that, process, As
Here is a recipe for making rice pudding. First of all pour a litre of milk in a heavy bottom saucepan and boil it. As soon as it boils, take out half of the milk from the pan. Then mix a cup of rice and stir it with a dipper for 15 minutes on a low flame. After that, add the remaining milk and stir it for sometimes. Finally, add half a cup of sugar and stir it. When it looks very soft, add half a spoon of cinnamon powder, 20 grams of grated dry coconut, 20 grams of raisins and 20 grams of fresh ghee. Stir it for a minute. Now your rice pudding is ready, serve it on a flat plate and have it.
Suppose your parents earn Rs. 30,000 per month. They spend their income on different sectors. They spend Rs. 6,000 on rent, Rs. 10,000 on food, Rs. 5,000 on education, Rs. 3,000 on entertainment and save Rs. 6,000 in each month. Show this data in a pie chart, and then explain it in detail.
Here is a pie chart representing the distribution of your parents' monthly income of Rs. 30,000:
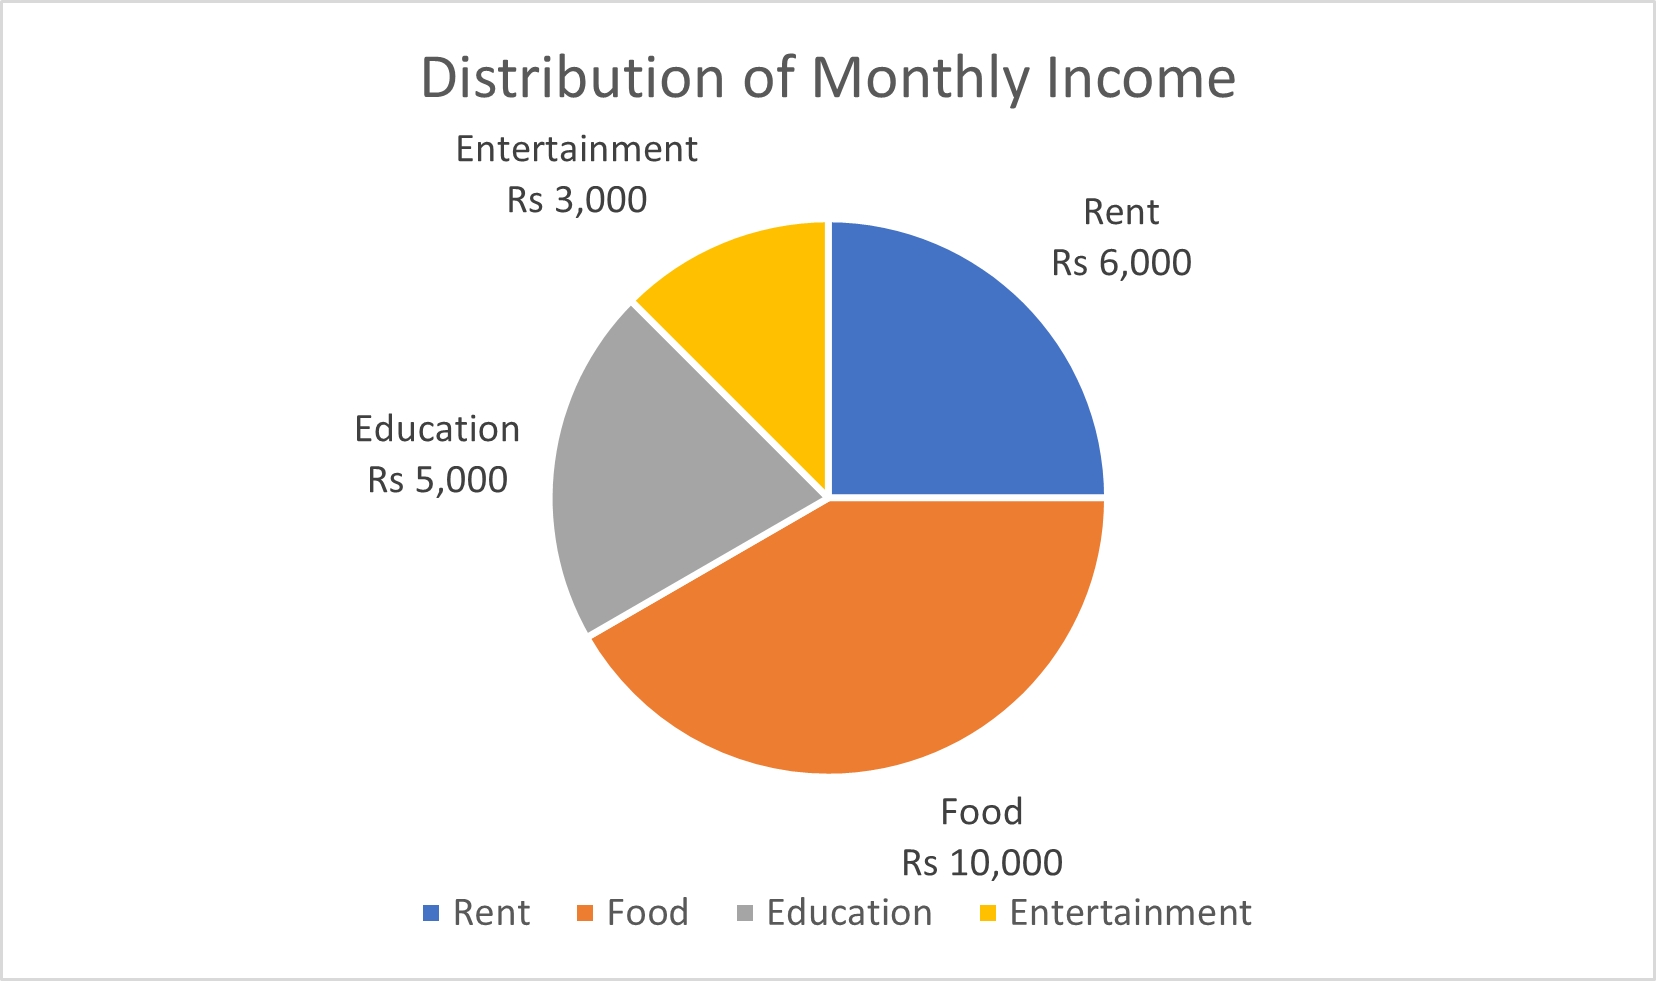
In this pie chart, the sectors in which your parents spend their income are represented by different sections of the pie. The largest section, representing 40% of their income, is allocated to food expenses (Rs. 10,000 out of Rs. 30,000). Rent expenses make up 20% of their income (Rs. 6,000 out of Rs. 30,000). Education expenses make up 16.7% of their income (Rs. 5,000 out of Rs. 30,000). Entertainment expenses make up 10% of their income (Rs. 3,000 out of Rs. 30,000). The final section of the pie chart represents the amount that your parents save each month, which is 20% of their income (Rs. 6,000 out of Rs. 30,000).
Overall, this pie chart shows that the majority of your parents' monthly income is allocated to basic necessities such as food and housing, with a smaller portion going towards education and entertainment. The remaining 20% is saved for the future.
Grammar
Rewrite the following sentences using the appropriate connectives in the box.
in order to, so that, as long as, before, after, although, whenever, despite, though, as soon as
a. Namita didn't get good marks in the exam although she had studied well.
b. She goes to the river to fetch water.
c. They went to Ilam so that they could enjoy observing the tea garden.
d. Mallik has topped the list despite his negligence.
e. Although my uncle is rich, he never buys expensive clothes.
f. Whenever you are free, you can come.
g. You can stay with me as long as you want.
h. They will come after they listen to the news.
i. He had been to Jhapa before he passed Master of Business Studies.
j. The passengers tied their seat belts as soon as the plane took off.
Read the following text and fill in the blanks with the appropriate words.
Overall, First, in which, Following this, which, Finally, next
Here is the process that explains the ways in which bricks are made for the building industry. Overall, there are seven stages in the process, beginning with the digging up of clay and culminating in the final product. First, the clay which is used to make the bricks, is dug up from the ground by a large digger. This clay is then placed onto a metal grid, which is used to break up the clay into smaller pieces. A roller assists in this process.
Following this, sand and water are added to the clay, and this mixture is turned into bricks by either placing it into a mould or using a wire cutter. Next, these bricks are placed in an oven to dry for 24-48 hours.
In the subsequent stage, the bricks go through a heating and cooling process. They are heated in a kiln at a moderate and then a high temperature, followed by a cooling process in a chamber for 2-3 days. Finally, the bricks are packed and delivered to their destinations.