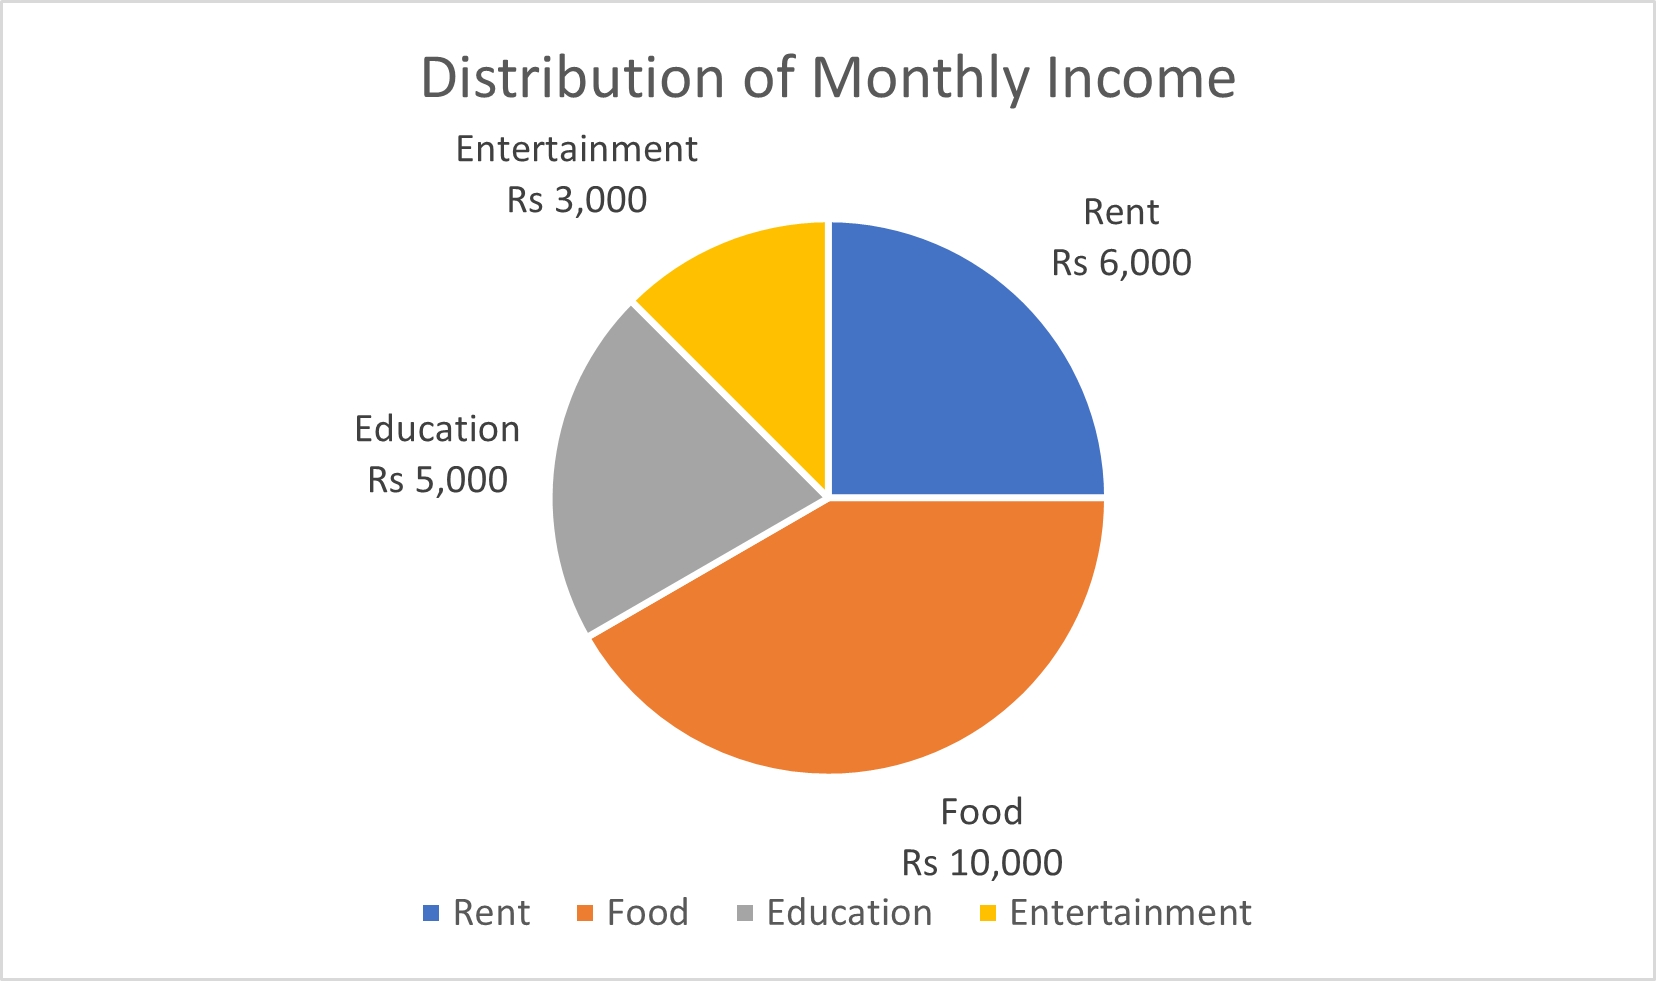
Suppose your parents earn Rs. 30,000 per month. They spend their income on different sectors. They spend Rs. 6,000 on rent, Rs. 10,000 on food, Rs. 5,000 on education, Rs. 3,000
full question: Suppose your parents earn Rs. 30,000 per month. They spend their income on different sectors. They spend Rs. 6,000 on rent, Rs. 10,000 on food, Rs. 5,000 on education, Rs. 3,000 on entertainment and save Rs. 6,000 in each month. Show this data in a pie chart, and then explain it in detail.
please help me